
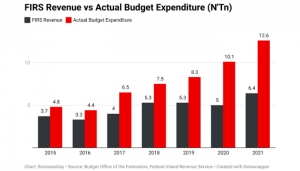
The theory that “Nigerians do not pay tax” must have been defeated with the recent record breaking feat of the Federal Inland Revenue Service (FIRS), after the agency generated a record breaking revenue of over N10 trillion in a single year.
Read Also: She Expected Free Money From Tinubu — APC Slams Naja’atu Muhammad
FIRS boss, Muhammad Nami, revealed this on Monday, after briefing President Muhammadu Buhari. The release was contained in a document titled the FIRS 2022 Performance Update.
The breakdown of revenue states that, “Non-oil taxes contributed 59% of the total collection, while oil tax collection stood at 41% of total collection.”
Companies Income Tax contributed N2.83 trillion; Value Added Tax N2.51 trillion; Electronic Money Transfer Levy N125.67 billion and Earmarked Taxes N353.69 billion.
The report further clarified that included in the total revenue sum is N146.27 billion which is the total value of certificates issued by the Service to private investors and NNPC for road infrastructure under the Road Infrastructure Development Refurbishment Investment Tax Credit Scheme created by Executive Order No. 007 of 2019.
The report also stated that the N10.1 trillion is exclusive of tax waived on account of various tax incentives granted under the respective laws, which amounted to N1,805,040,163,008.
Read Also: PVC Collection: Group Urge Soludo To Declare Work-Free Day

Though the agency failed to hit its target of N10.44 trillion for 2022, yet it generated a record breaking revenue of N10.1 trillion.


